Game Engine Performance Optimization: Diagnose the Bottleneck Before You Fix Anything
-

Written byDenys Zadoienyi
-

Updated on21.09.2026
-

Time to read12 min

- Why “Just Optimize” Isn’t a Diagnosis
- Game Thread, Render Thread, RHI Thread, or GPU? The First Test
- Rendering-Side Bottlenecks: CPU Submission vs. Actual GPU Cost
- Common CPU Bottlenecks Beyond Rendering Submission
- Streaming and Memory Bottlenecks
- Where Nanite, Lumen, and World Partition Change the Profiling Picture
- A Practical Profiling Sequence
- When Profiling Capacity Is the Actual Gap
- Bottleneck Type at a Glance
- Conclusion: Profile the Bottleneck, Then Choose the Fix
Game engine performance optimization only works in the order that sounds obvious and gets skipped constantly: profile first, then fix what the profiler actually shows you – not what looks expensive. The most common failure mode isn’t a bad optimization technique. It’s applying a real technique to the wrong bottleneck, spending a milestone’s worth of technical-art time reducing draw calls on a scene whose actual constraint was game-thread logic or GPU shader cost the whole time.
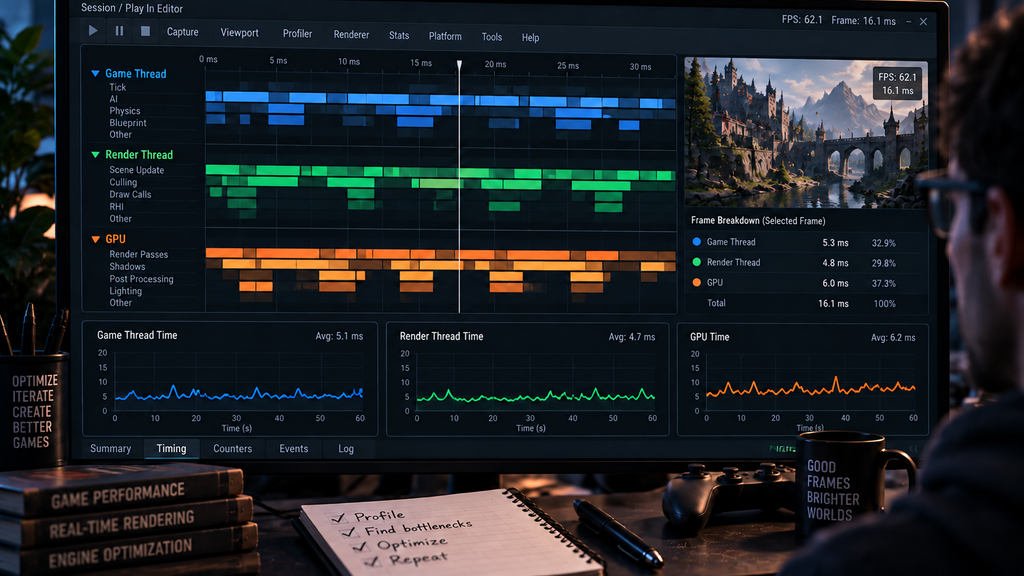
“Editorial illustration created for visual reference purposes. It does not represent a real project, client work, or official software screenshot unless stated otherwise.”
Game engine performance optimization is the process of measuring where a frame’s time actually goes – the CPU Game Thread, the CPU Render Thread and, where relevant, the RHI Thread, and the GPU are distinct resources with distinct costs – and addressing the specific one that’s constraining frame rate, rather than applying general-purpose fixes and hoping one of them helps.
Why “Just Optimize” Isn’t a Diagnosis
A scene that hitches, stutters, or misses its frame budget has one of several distinct causes, and the fix for each one is different enough that guessing wrong costs real production time. Reducing draw calls does nothing for a CPU-bound game thread. Simplifying shaders does nothing for a streaming hitch. Cutting texture resolution does nothing if the actual cost is overdraw from stacked transparent effects. Every one of these is a legitimate optimization technique, and every one of them is a wasted pass if it’s aimed at the wrong bottleneck.
The practical implication for a producer scoping an optimization pass: “optimize the level” isn’t a task with a clear scope or a clear estimate until someone has profiled it and named the actual bottleneck. A technical artist asked to “make it faster” without that diagnosis is guessing on the studio’s clock.
Game Thread, Render Thread, RHI Thread, or GPU? The First Test
“Editorial illustration created for visual reference purposes. It does not represent a real project, client work, or official software screenshot unless stated otherwise.”
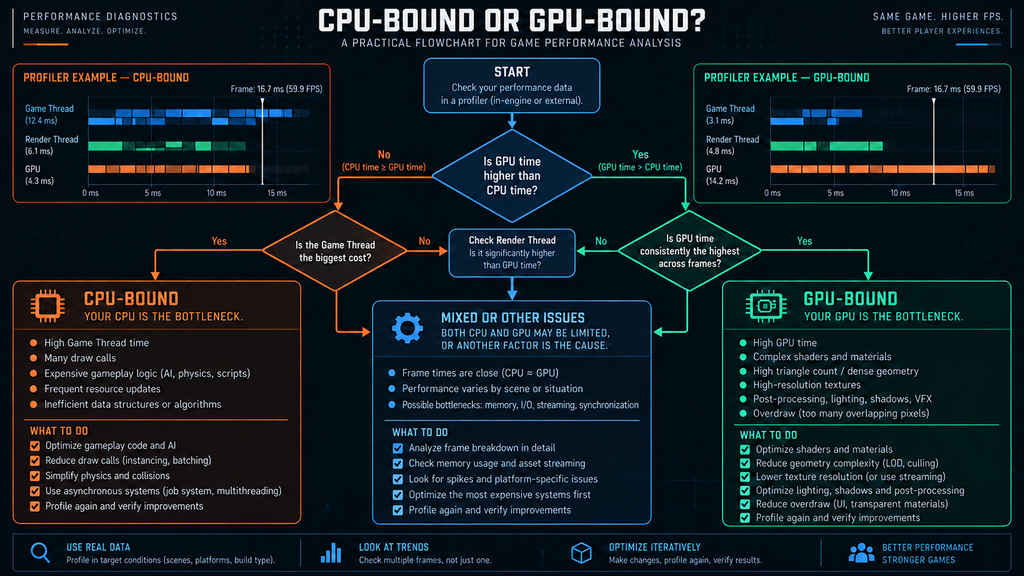
Before drilling into any specific technique, the first question is which resource is actually constraining frame time – and Unreal Engine’s own stat unit command is built specifically to help answer that question first. It reports Frame, Game, Draw, GPU, and RHIT time together: if Frame time is close to Game, suspect the Game Thread; if it’s close to Draw, suspect the Render Thread; if RHIT is dominant, investigate RHI-thread submission specifically; GPU timing points to the GPU itself. Game, Draw, and RHIT are all distinct CPU-side measurements – the GPU is the only one of the four that isn’t running on the CPU at all – but stat unit identifies the likely dominant resource, not a confirmed diagnosis on its own, since GPU and RHIT time are synced to the frame and can read close to each other regardless of which one actually constrains it. Confirm with a deeper, resource-specific capture before committing a fix.
A substantial resolution reduction is a useful secondary check once stat unit has pointed at the GPU: a meaningful frame-rate improvement is strong evidence of a pixel, fill-rate, or shading-related GPU cost. But little change on its own doesn’t prove the bottleneck is CPU-side – some GPU costs (geometry processing, shadow rendering, certain Lumen passes) are comparatively insensitive to output resolution, so a flat result just means the cost isn’t resolution-dependent, not that the CPU is definitely at fault. Treat the resolution test as a workload perturbation that narrows the investigation, not a binary detector on its own.
Rendering-Side Bottlenecks: CPU Submission vs. Actual GPU Cost
The rendering pipeline splits across two different resources, and conflating them is a common diagnostic mistake:
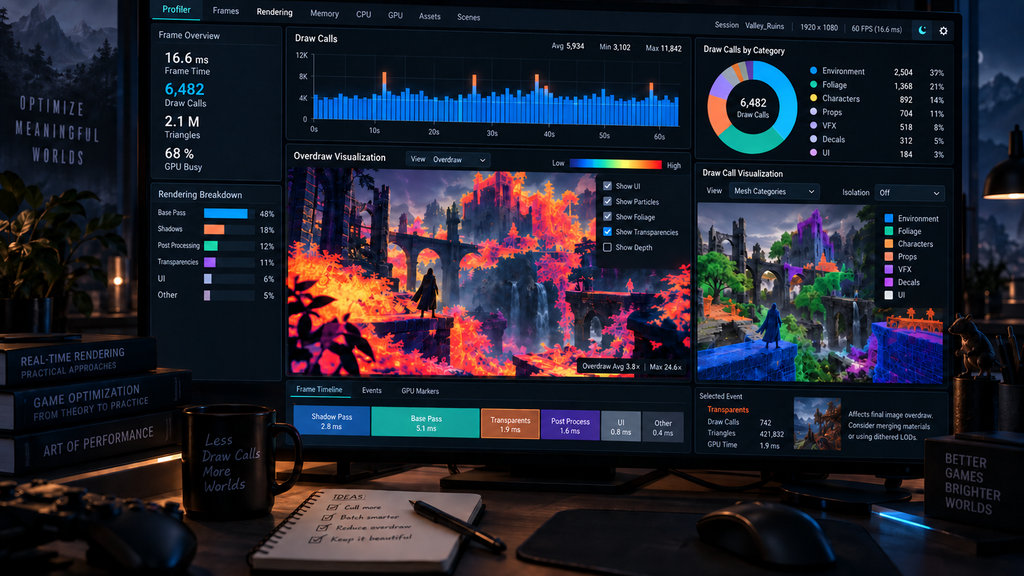
- Render/RHI-thread submission overhead (CPU-side). Draw-call submission overhead is primarily CPU-side, on the Render Thread and, for command-list submission specifically, the RHI Thread. Each distinct draw call carries CPU cost to build and submit – state changes, buffer bindings, and material switches all add up before the GPU starts rendering. Draw count can still correlate with GPU workload, though, so the number alone doesn’t identify which side is actually limiting the frame – confirm with stat unit before assuming submission is the constraint. Batching, instancing, and merging static geometry are the standard responses, but the payoff depends entirely on how much of the Render/RHI Thread’s time draw-call submission was actually consuming; a scene that’s already game-thread-bound or GPU-shader-bound gains little from batching work that was never the constraint.
- GPU pixel and fill-rate cost. Overdraw – transparent and stacked geometry like particles, foliage, UI layers, and translucent VFX shading the same pixel multiple times per frame – shows up clearly in an overdraw visualization mode and is a common, underdiagnosed cost on scenes that otherwise look geometry-light.
- GPU shader and material cost. A material sampling many textures and running expensive per-pixel calculations costs more the more of the screen it covers. The same shader that’s invisible in cost on a small prop can dominate frame time once it covers a full-screen background element.
- GPU rasterization, geometry, and shadow cost. Vertex processing, geometry throughput, and shadow-map rendering are genuine GPU costs distinct from pixel shading – a scene can be GPU-bound on shadow rendering specifically, which reads differently in a profiler than a fill-rate problem.
“Editorial illustration created for visual reference purposes. It does not represent a real project, client work, or official software screenshot unless stated otherwise.”
Common CPU Bottlenecks Beyond Rendering Submission
Separately from rendering submission, gameplay and simulation logic are their own CPU cost centers:
- Gameplay logic and AI. Gameplay code, AI decision-making, and behavior tree evaluation typically run on the Game Thread, and a heavy tick function or an expensive AI update loop across many actors can dominate frame time well before rendering is stressed at all.
- Physics and collision. Physics simulation is CPU-side, but its threading model depends on engine configuration – Chaos can run through the Task Graph or a dedicated threading setup rather than strictly on the Game Thread. Either way, dense collision geometry, a high count of simulated rigid bodies, or physics synchronization overhead can contribute substantially to frame time without appearing as GPU cost or necessarily showing up as Game Thread time specifically.

Streaming and Memory Bottlenecks
Streaming and memory issues are their own category, separate from both GPU shading cost and CPU logic cost, and worth diagnosing on their own terms:
- Texture streaming. This involves the streaming pool budget, asset I/O, mip residency, and async streamer throughput – not simply GPU texture-sampling bandwidth. A streaming pool that can’t keep ahead of camera movement produces visible pop-in or a hitch independent of how efficient the shaders themselves are.
- PSO and shader compilation hitches. Runtime shader and Pipeline State Object compilation is a well-documented source of hitches in UE5 specifically – a stutter that looks like a rendering bottleneck can actually be a shader compiling for the first time mid-gameplay, which calls for PSO precaching rather than any of the fixes above.
- World Partition cell loading and asset activation. On an open-world project, a hitch tied to camera movement rather than a consistently low frame rate often traces to cell streaming or actor activation rather than raw rendering cost – covered in more detail below.
Where Nanite, Lumen, and World Partition Change the Profiling Picture
On a modern UE5 pipeline specifically, three systems shift what “profiling” actually means, and treating them as a black box during an optimization pass is a common way to misdiagnose a bottleneck:
- Nanite changes the geometry budget model rather than eliminating geometry-related cost. Manual LOD authoring and raw source polycount matter less than in a traditional pipeline, since in typical cases Nanite scales rendered detail primarily with screen resolution rather than raw source-scene complexity – but culling and rasterization cost, overdraw (especially from aggregate geometry like foliage and closely stacked surfaces), instance count, material count and complexity, World Position Offset usage, and masked materials all remain real profiling signals, not eliminated ones. Our guide to Nanite in UE5 covers this profiling workflow in depth, including the Nanite-specific visualization modes that reveal it.
- Lumen turns global illumination and reflections into a measurable real-time GPU workload – Scene Lighting, Screen Probe Gather, and Reflections are separate passes with separate costs, and hardware ray tracing setup adds its own overhead where it’s enabled. Noisy reflections or a blown frame budget reads very differently across these passes than a traditional baked-lighting bottleneck ever did – see our breakdown of how Lumen works for the platform-specific constraints that show up here.
- World Partition introduces a distinct failure mode: a streaming hitch that looks like a frame-rate problem but is actually cell loading, HLOD asset activation, or an unexpected cross-reference bundling actors together at runtime. HLOD generation itself is a build-time process, not something that happens during play – the runtime cost worth profiling is loading and activating the already-generated HLOD proxies as cells stream in and out. Our World Partition workflow guide covers the streaming and HLOD mechanics a profiling pass needs to account for on an open-world scene.
Treating all three as “the engine is slow” instead of profiling each system’s specific cost is one of the more common ways an optimization pass burns time without moving the frame rate.
A Practical Profiling Sequence
A profiling pass that produces an actual diagnosis, rather than a guess, tends to follow roughly this order:
- Define the target. A frame budget, the target hardware, and a representative scene – a profiling result from an editor session on a development workstation doesn’t predict console or mobile performance reliably, so prefer a representative packaged build on target hardware whenever possible.
- Capture Frame, Game, Draw, and GPU timing with stat unit (or the equivalent in your engine) to identify which resource is dominant before touching anything else.
- Use workload perturbation as a secondary check. A substantial resolution change, toggling a specific feature, or varying actor counts can confirm or complicate the initial read – treat these as evidence-gathering, not a final verdict on their own.
- Deep-dive the dominant resource. On the Render or RHI Thread, check draw call count and state-change frequency. On the GPU, check overdraw visualization, shader cost, and rasterization/shadow timing separately (including Nanite or Lumen-specific views if applicable). On the Game Thread, profile gameplay ticks and check how physics/Chaos is threaded in your project.
- Isolate before fixing. Distinguish a content-authoring problem (an unbatched prop, an oversized texture) from a systemic one (a renderer configuration, a streaming setup) before choosing a fix – the two require different owners and different timelines.
- Re-profile after every change. If the targeted subsystem metric improves but overall frame time doesn’t, check whether another bottleneck has become dominant or whether the change was simply too small to affect the critical path – both are more useful next steps than assuming the fix failed.
When Profiling Capacity Is the Actual Gap
Some studios have the profiling expertise in-house and simply need the time allocated for it. Others discover mid-production that nobody on the team has actually run this kind of diagnosis before, which is a different problem than a busy schedule. A quick check:
- Someone on the team can capture and read a stat unit or Unreal Insights trace, not just describe what one is.
- Someone can identify, from an actual capture, whether the Game Thread, the Render Thread, the RHI Thread, or the GPU is dominant.
- Your team has profiled a packaged build on target hardware, not only an editor session on a dev workstation.
- Your last “optimization pass” is backed by a before/after capture showing a specific metric moved, not just a subjective sense that it felt smoother.
- Someone owns interpreting Nanite, Lumen, or World Partition-specific profiling output, if your project uses them.
If several of these don’t hold, that’s a capability gap worth naming honestly before a milestone gate forces the question. Our guide to vetting UE5 technical expertise covers what to look for whether you’re hiring in-house or bringing in outside support for exactly this kind of diagnostic work.
Bottleneck Type at a Glance
| Symptom | What it suggests | Check next |
| Frame time tracks GPU time in stat unit; lower resolution materially helps | Pixel/fill/shading-sensitive GPU cost | Overdraw visualization, shader/material cost, Nanite or Lumen-specific passes |
| Frame time tracks GPU time but resolution has little effect | GPU cost that’s comparatively resolution-insensitive | Geometry/rasterization, shadow rendering, Lumen ray tracing |
| Frame time tracks Draw/RHIT time in stat unit | CPU render-thread submission bottleneck | Draw call count, state/material change frequency |
| Frame time tracks Game time in stat unit | CPU gameplay bottleneck | AI, physics, tick functions, scripting |
| Stutter tied to camera movement, not a fixed cost | Streaming, I/O, asset activation, or first-use shader/PSO compilation | Texture streaming pool, World Partition cell loading, asset activation traces, PSO/shader compilation events |
| High GPU cost on a Nanite-heavy scene | Possible overdraw, aggregate geometry, or material/instance cost | Nanite overdraw and cluster visualizations, material count, WPO usage |
| Noisy or expensive global illumination | Lumen-specific pass cost | Scene Lighting, Screen Probe Gather, Reflections, ray tracing settings |
This is a starting point for the next capture, not a deterministic diagnosis on its own – a single symptom can have more than one plausible cause, which is exactly why the sequence above calls for confirming with a targeted capture rather than stopping at the first plausible match.
Conclusion: Profile the Bottleneck, Then Choose the Fix
Every optimization technique in this article is a legitimate tool, and every one of them is a wasted pass when it’s aimed at a bottleneck the scene doesn’t actually have. The discipline that actually saves production time isn’t knowing more techniques – it’s establishing, with a profiler and a re-measured number, which one the scene needs before committing a milestone’s schedule to it.
“Editorial illustration created for visual reference purposes. It does not represent a real project, client work, or official software screenshot unless stated otherwise.”
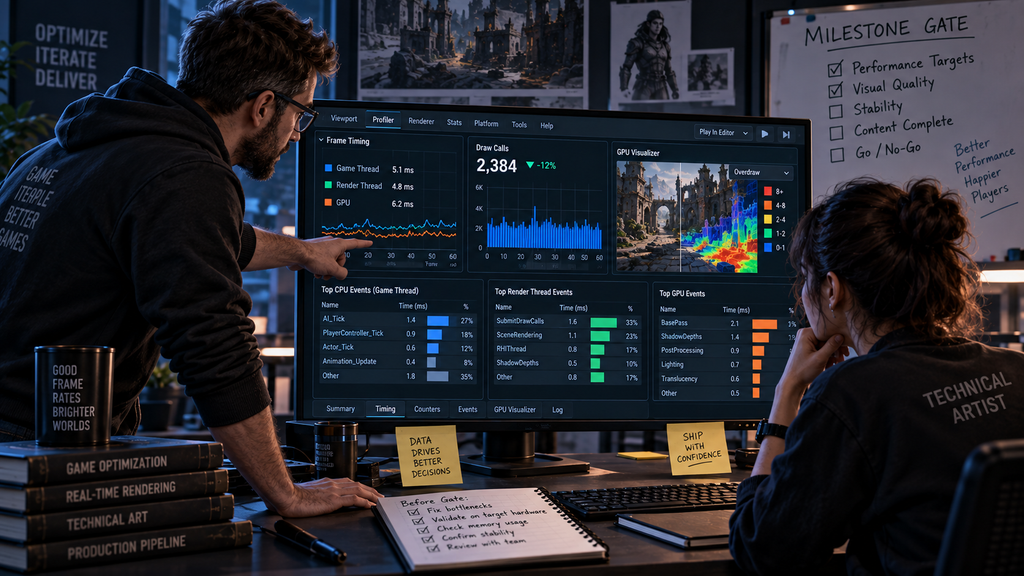
If a milestone gate is approaching and nobody on the team has run this diagnosis yet, that’s worth surfacing now rather than during the gate review.
Struggling with performance bottlenecks? Get a technical audit →